The type of frequency plot depends on the number of selected columns:
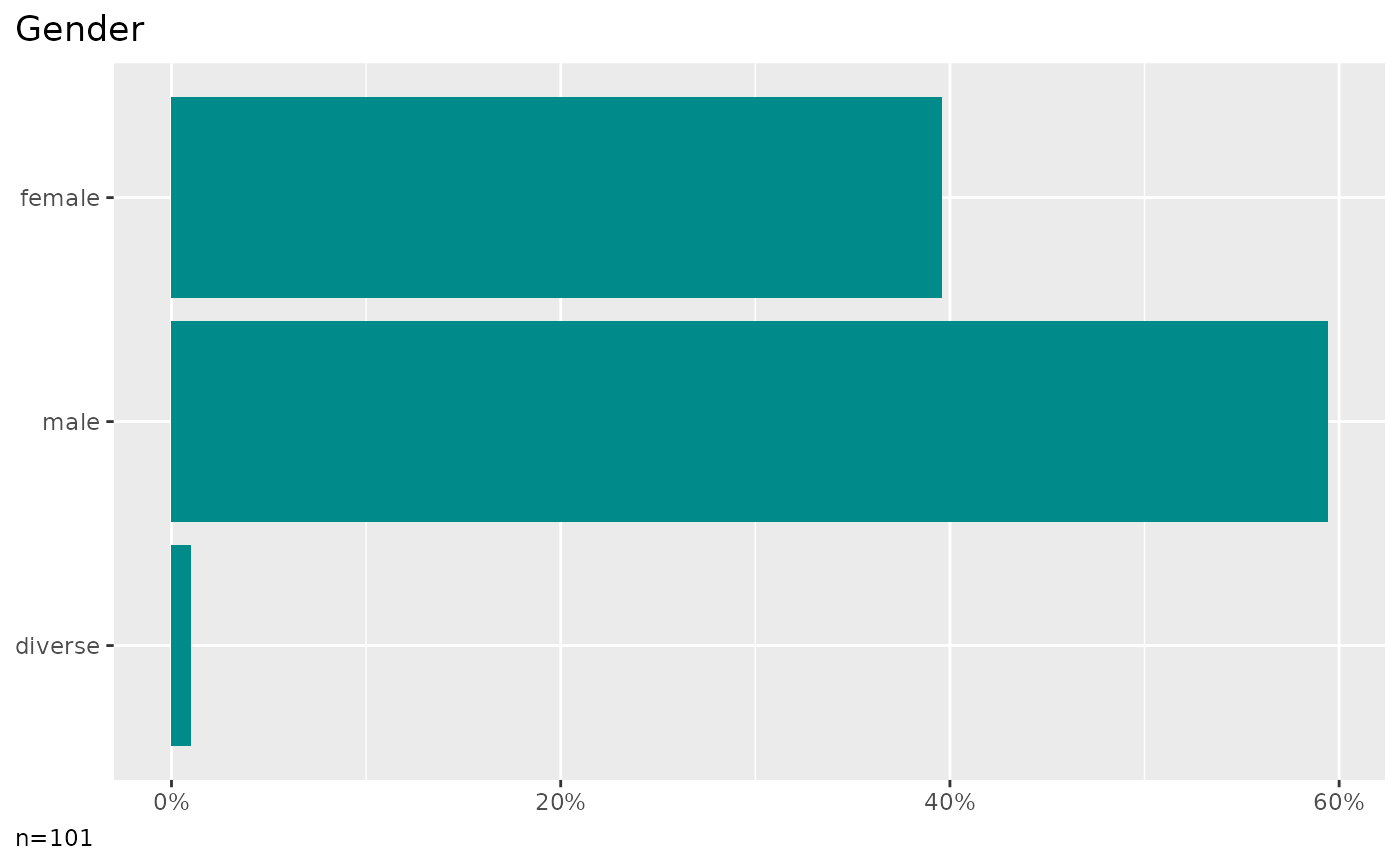
One categorical column: see plot_counts_one
Multiple categorical columns: see plot_counts_items
Cross tabulations:
One categorical column and one grouping column: see plot_counts_one_grouped
Multiple categorical columns and one grouping column: see plot_counts_items_grouped
Two categorical column selections: see plot_counts_items_grouped_items
By default, if you provide two column selections, the second selection is treated as categorical. Setting the metric-parameter to TRUE will call the appropriate functions for correlation analysis:
One categorical column and one metric column: see plot_counts_one_cor
Multiple categorical columns and one metric column: see plot_counts_items_cor
Multiple categorical columns and multiple metric columns: see plot_counts_items_cor_items (not yet implemented)
Parameters that may be passed to the count functions (see the respective function help):
ci: Add confidence intervals to proportions.
ordered: The values of the cross column can be nominal (0), ordered ascending (1), or ordered descending (-1). The colors are adjusted accordingly.
category: When you have multiple categories in a column, you can focus one of the categories to simplify the plots. By default, if a column has only TRUE and FALSE values, the outputs focus the TRUE category.
prop: For stacked bar charts, displaying row percentages instead of total percentages gives a direct visual comparison of groups.
limits: The scale limits are automatically guessed by the package functions (work in progress). Use the limits-parameter to manually fix any misleading graphs.
title: All plots usually get a title derived from the column attributes or column names. Set to FALSE to suppress the title or provide a title of your choice as a character value.
labels: Labels are extracted from the column attributes. Set to FALSE to output bare column names and values.
numbers: Set the numbers parameter to “n” (frequency), “p” (percentage) or c(“n”,“p”). To prevent cluttering and overlaps, numbers are only plotted on bars larger than 5%.
width: When comparing groups by row of column percentages, by default, the bar or column width reflects the number of cases. You can disable this behavior by setting width to FALSE.
![[Experimental]](figures/lifecycle-experimental.svg)
Arguments
- data
A data frame.
- cols
A tidy column selection, e.g. a single column (without quotes) or multiple columns selected by methods such as starts_with().
- cross
Optional, a grouping column. The column name without quotes.
- metric
When crossing variables, the cross column parameter can contain categorical or metric values. By default, the cross column selection is treated as categorical data. Set metric to TRUE, to treat it as metric and calculate correlations.
- clean
Prepare data by data_clean.
- ...
Other parameters passed to the appropriate plot function.