Output frequencies for multiple variables
Usage
plot_counts_items(
  data,
  cols,
  category = NULL,
  ordered = NULL,
  ci = FALSE,
  limits = NULL,
  numbers = NULL,
  title = TRUE,
  labels = TRUE,
  clean = TRUE,
  ...
)
Arguments
- data
A tibble containing item measures.
- cols
Tidyselect item variables (e.g. starts_with...).
- category
The value FALSE will force to plot all categories. A character value will focus a selected category. When NULL, in case of boolean values, only the TRUE category is plotted.
- ordered
Values can be nominal (0) or ordered ascending (1) descending (-1). By default (NULL), the ordering is automatically detected. An appropriate color scale should be choosen depending on the ordering. For unordered values, colors from VLKR_FILLDISCRETE are used. For ordered values, shades of the VLKR_FILLGRADIENT option are used.
- ci
Whether to plot error bars for 95% confidence intervals.
- limits
The scale limits, autoscaled by default. Set to
c(0,100)to make a 100 % plot.- numbers
The values to print on the bars: "n" (frequency), "p" (percentage) or both.
- title
If TRUE (default) shows a plot title derived from the column labels. Disable the title with FALSE or provide a custom title as character value.
- labels
If TRUE (default) extracts labels from the attributes, see codebook.
- clean
Prepare data by data_clean.
- ...
Placeholder to allow calling the method with unused parameters from plot_counts.
Examples
library(volker)
data <- volker::chatgpt
plot_counts_items(data, starts_with("cg_adoption_"))
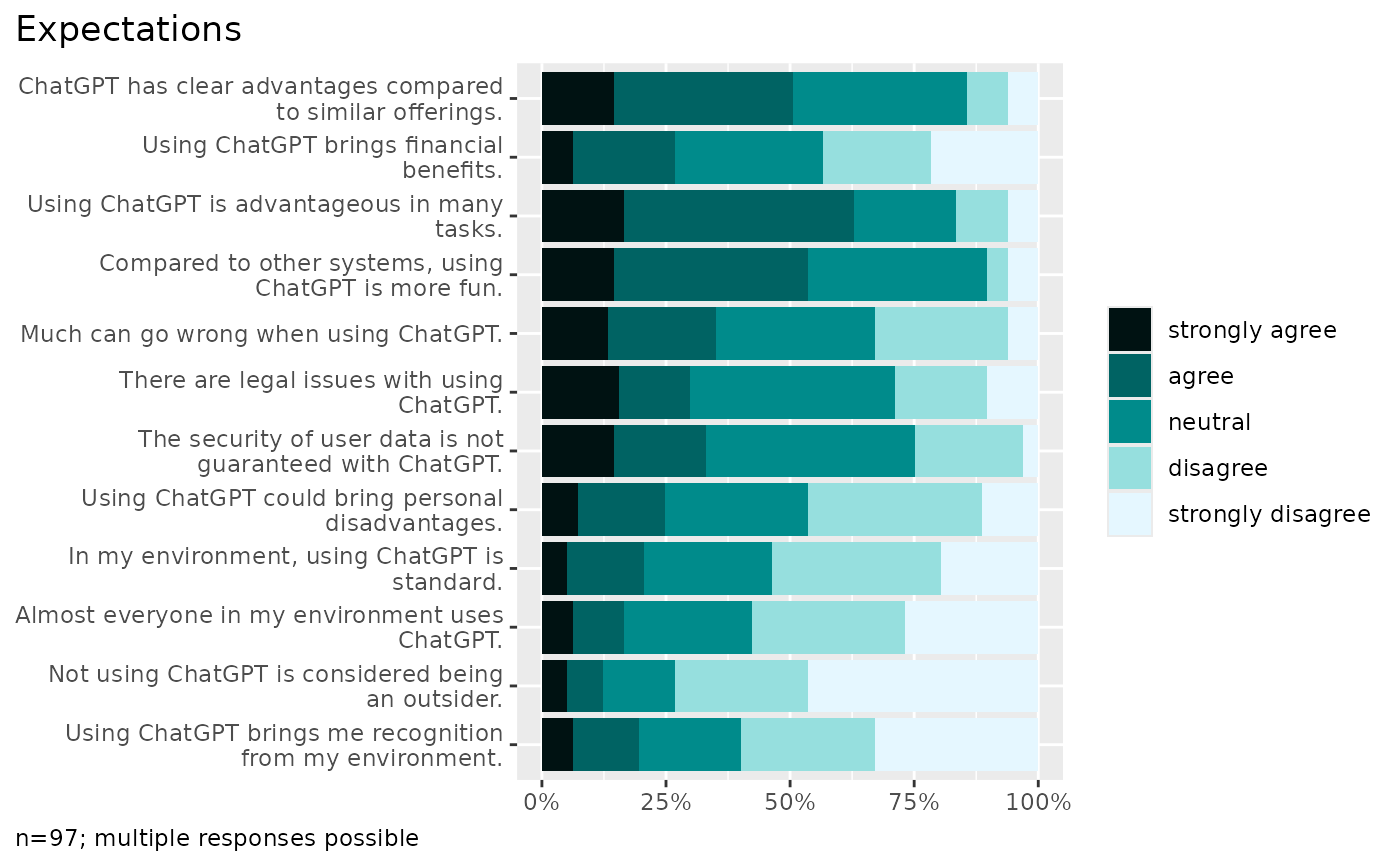 #> In the plot, 4 missing case(s) omitted.