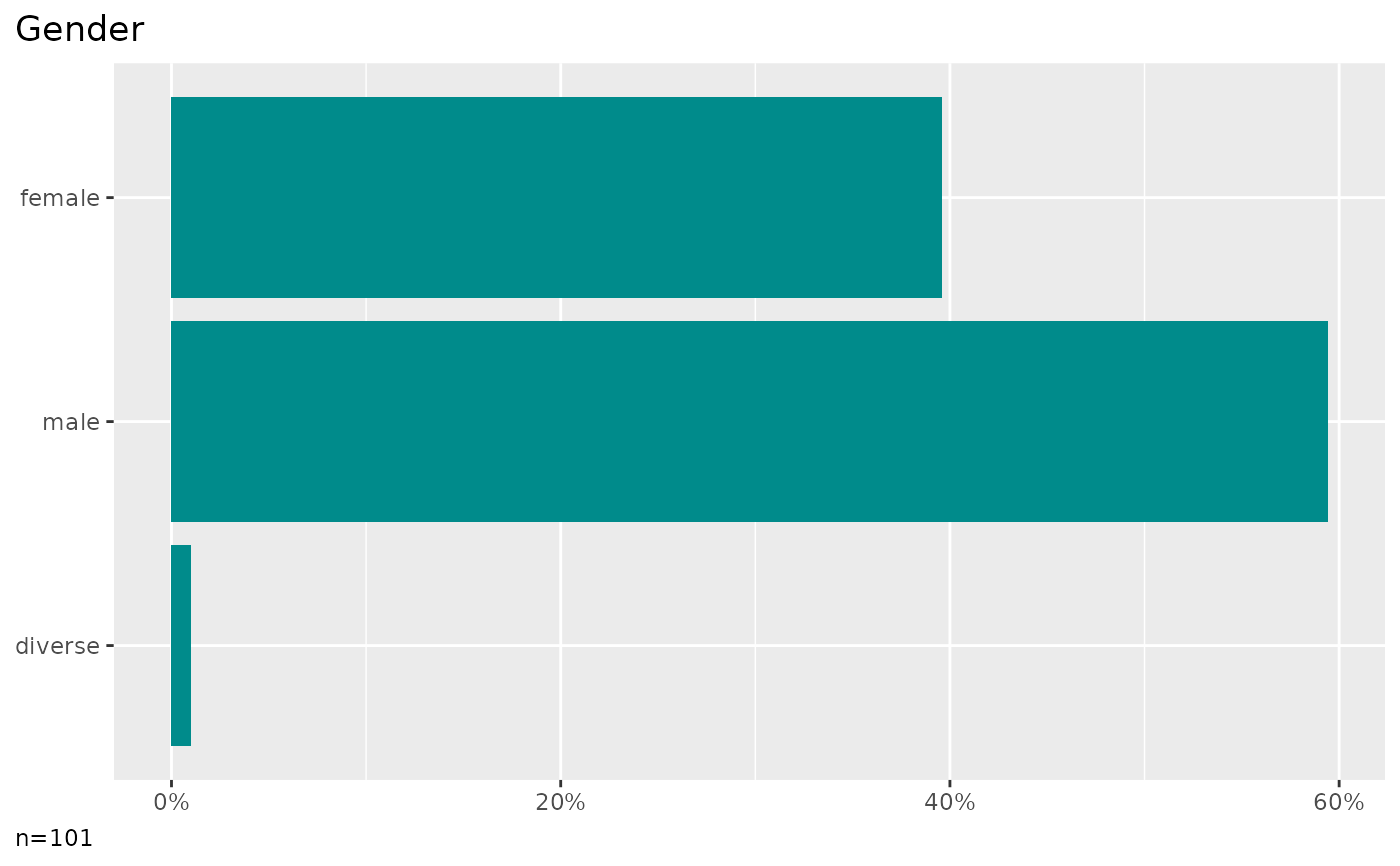
Depending on your column selection, different types of plots and tables are generated. See plot_counts and tab_counts.
Usage
report_counts(
  data,
  cols,
  cross = NULL,
  metric = FALSE,
  ids = NULL,
  agree = FALSE,
  index = FALSE,
  effect = FALSE,
  numbers = NULL,
  title = TRUE,
  close = TRUE,
  clean = TRUE,
  ...
)
Arguments
- data
A data frame.
- cols
A tidy column selection, e.g. a single column (without quotes) or multiple columns selected by methods such as starts_with().
- cross
Optional, a grouping column (without quotes).
- metric
When crossing variables, the cross column parameter can contain categorical or metric values. By default, the cross column selection is treated as categorical data. Set metric to TRUE, to treat it as metric and calculate correlations.
- ids
A column containing unique identifiers for the cases, used only in combination with the
agree-parameter.- agree
Setting agree to "reliability" or
TRUEadds reliability coefficients to the report (e.g. Kappa). Setting agree to "classification" adds classification performance indicators to the report (e.g. F1). You need to provide a column selection for values in thecols-parameter, provide a column with coders or classification source in thecross-parameter, and a column containing unique case ids to theids-parameter.- index
When the cols contain items on a metric scale (as determined by get_direction), an index will be calculated using the 'psych' package. Set to FALSE to suppress index generation.
- effect
Whether to report statistical tests and effect sizes. See effect_counts for further parameters.
- numbers
The numbers to print on the bars: "n" (frequency), "p" (percentage) or both. Set to NULL to remove numbers.
- title
A character providing the heading or TRUE (default) to output a heading. Classes for tabset pills will be added.
- close
Whether to close the last tab (default value TRUE) or to keep it open. Keep it open to add further custom tabs by adding headers on the fifth level in Markdown (e.g. ##### Method).
- clean
Prepare data by data_clean.
- ...
Parameters passed to the plot_counts and tab_counts and effect_counts functions.

