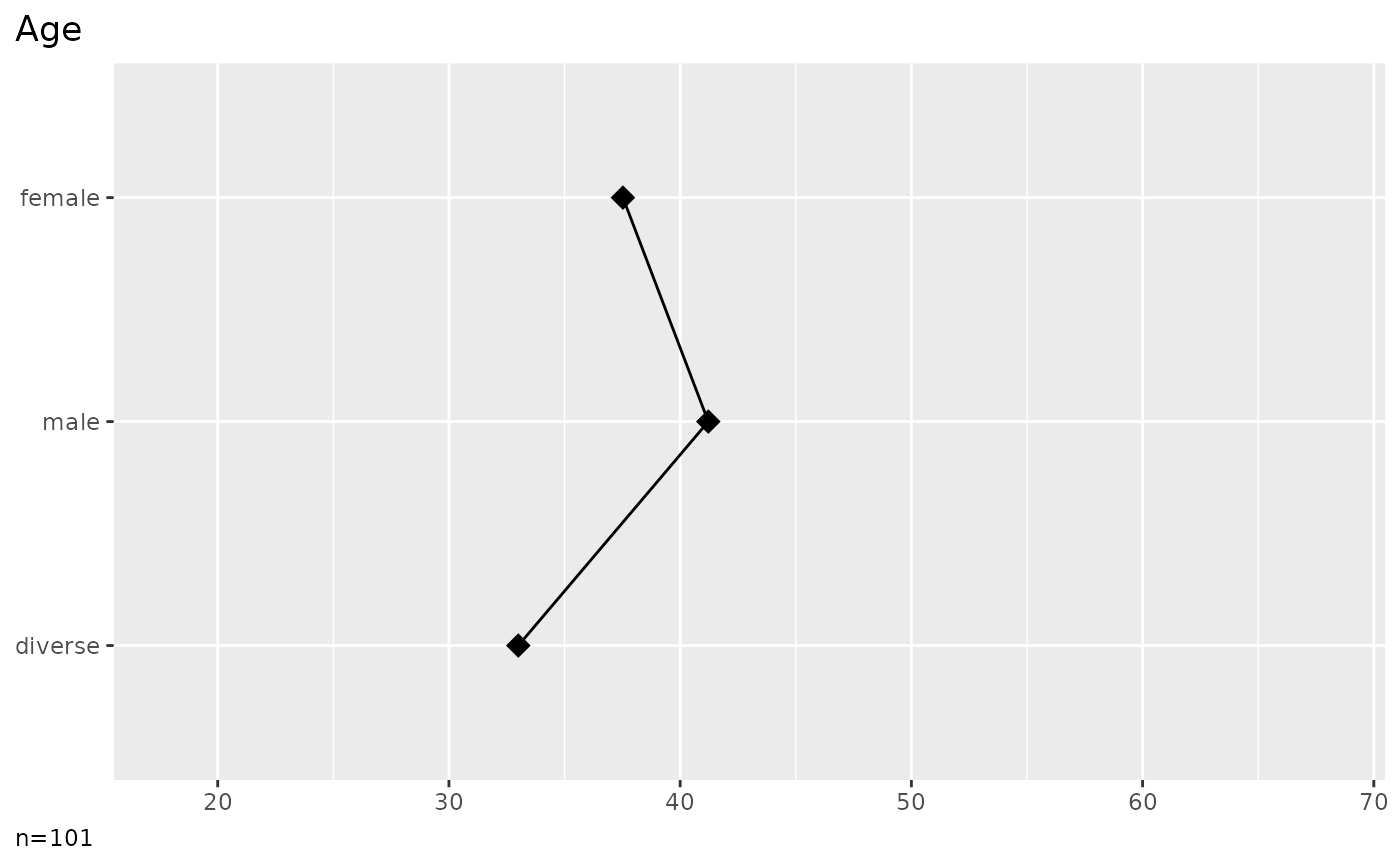
Output averages for multiple variables
Usage
plot_metrics_one_grouped(
  data,
  col,
  cross,
  ci = FALSE,
  box = FALSE,
  limits = NULL,
  title = TRUE,
  labels = TRUE,
  clean = TRUE,
  ...
)
Arguments
- data
A tibble.
- col
The column holding metric values.
- cross
The column holding groups to compare.
- ci
Whether to add error bars with 95% confidence intervals.
- box
Whether to add boxplots.
- limits
The scale limits. Set NULL to extract limits from the labels.
- title
If TRUE (default) shows a plot title derived from the column labels. Disable the title with FALSE or provide a custom title as character value.
- labels
If TRUE (default) extracts labels from the attributes, see codebook.
- clean
Prepare data by data_clean.
- ...
Placeholder to allow calling the method with unused parameters from plot_metrics.