Output averages for multiple variables compared by a grouping variable
Source:R/plots.R
plot_metrics_items_grouped.RdOutput averages for multiple variables compared by a grouping variable
Usage
plot_metrics_items_grouped(
  data,
  cols,
  cross,
  limits = NULL,
  title = TRUE,
  labels = TRUE,
  clean = TRUE,
  ...
)
Arguments
- data
A tibble containing item measures.
- cols
Tidyselect item variables (e.g. starts_with...).
- cross
The column holding groups to compare.
- limits
The scale limits. Set NULL to extract limits from the labels.
- title
If TRUE (default) shows a plot title derived from the column labels. Disable the title with FALSE or provide a custom title as character value.
- labels
If TRUE (default) extracts labels from the attributes, see codebook.
- clean
Prepare data by data_clean.
- ...
Placeholder to allow calling the method with unused parameters from plot_metrics.
Examples
library(volker)
data <- volker::chatgpt
plot_metrics_items_grouped(data, starts_with("cg_adoption_"), sd_gender)
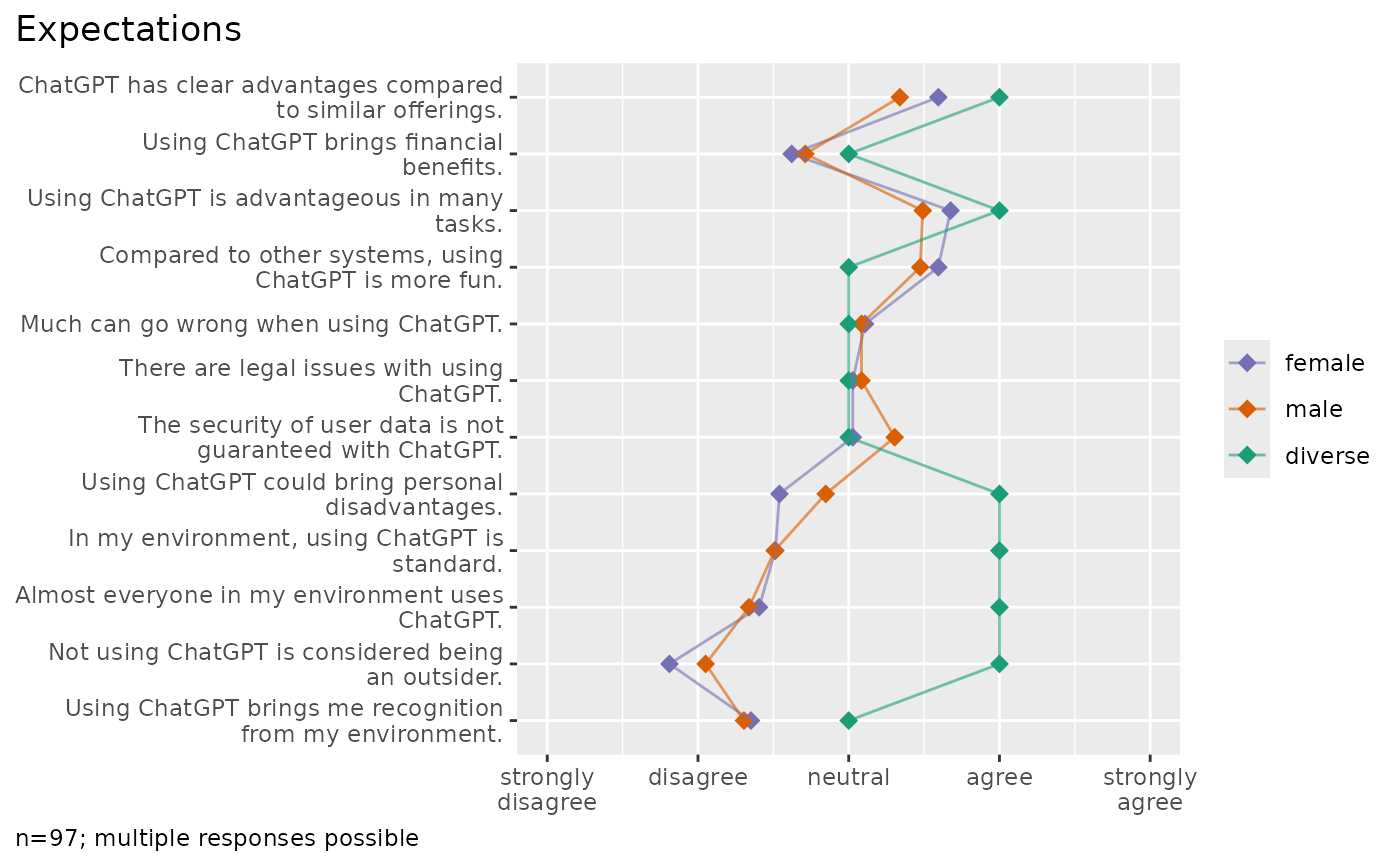 #> In the plot, 4 missing case(s) omitted.