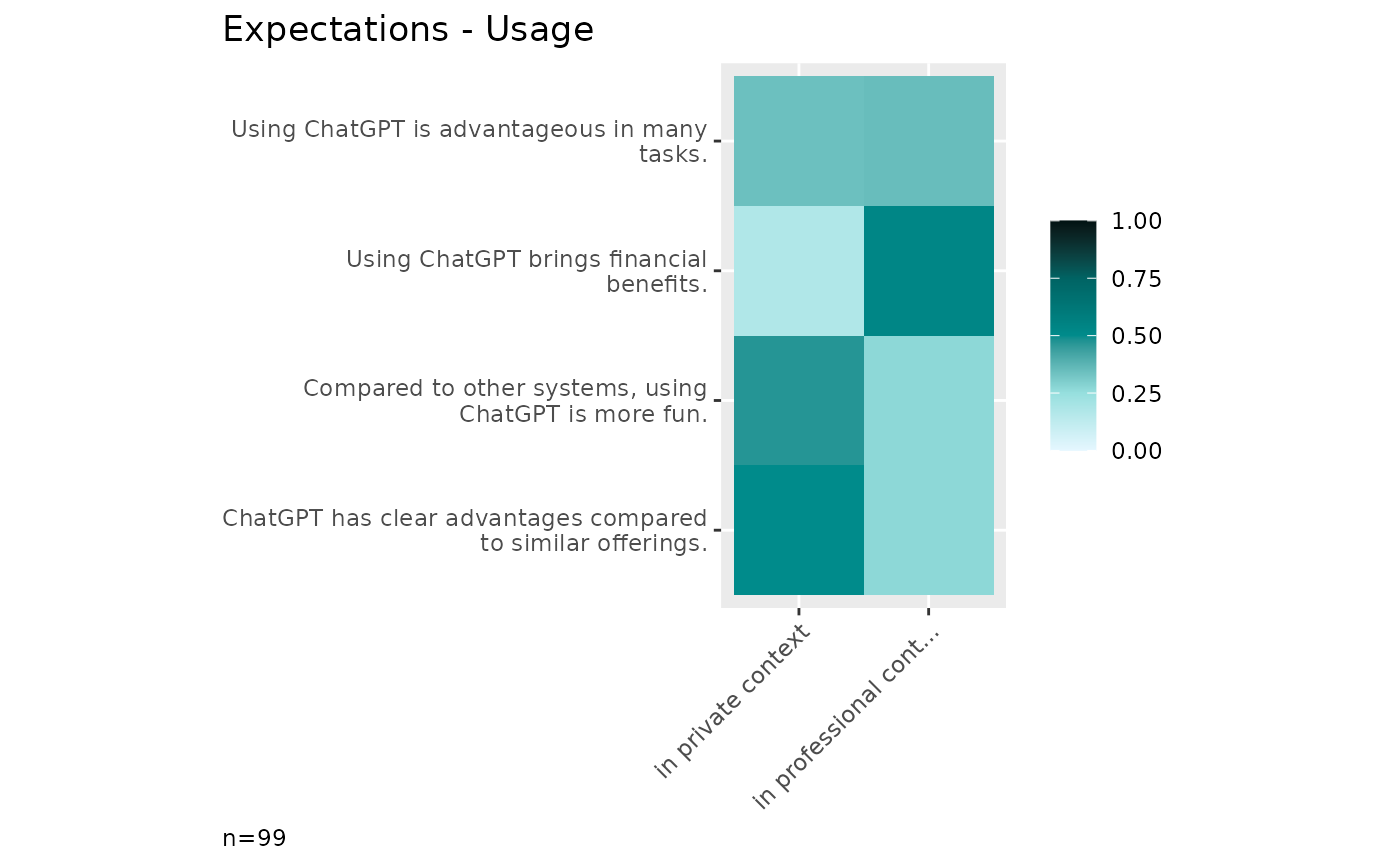
Heatmap for correlations between multiple items
Usage
plot_metrics_items_cor_items(
  data,
  cols,
  cross,
  method = "pearson",
  numbers = TRUE,
  title = TRUE,
  labels = TRUE,
  clean = TRUE,
  ...
)
Arguments
- data
A tibble containing item measures.
- cols
Tidyselect item variables (e.g. starts_with...).
- cross
Tidyselect item variables to correlate (e.g. starts_with...).
- method
The method of correlation calculation, pearson = Pearson's R, spearman = Spearman's rho.
- numbers
Whether to plot correlation coefficents on tiles. Default to TRUE.
- title
If TRUE (default) shows a plot title derived from the column labels. Disable the title with FALSE or provide a custom title as character value.
- labels
If TRUE (default) extracts labels from the attributes, see codebook.
- clean
Prepare data by data_clean.
- ...
Placeholder to allow calling the method with unused parameters from plot_metrics.
Examples
library(volker)
data <- volker::chatgpt

plot_metrics_items_cor_items(data, starts_with("cg_adoption_adv"), starts_with("use_"))