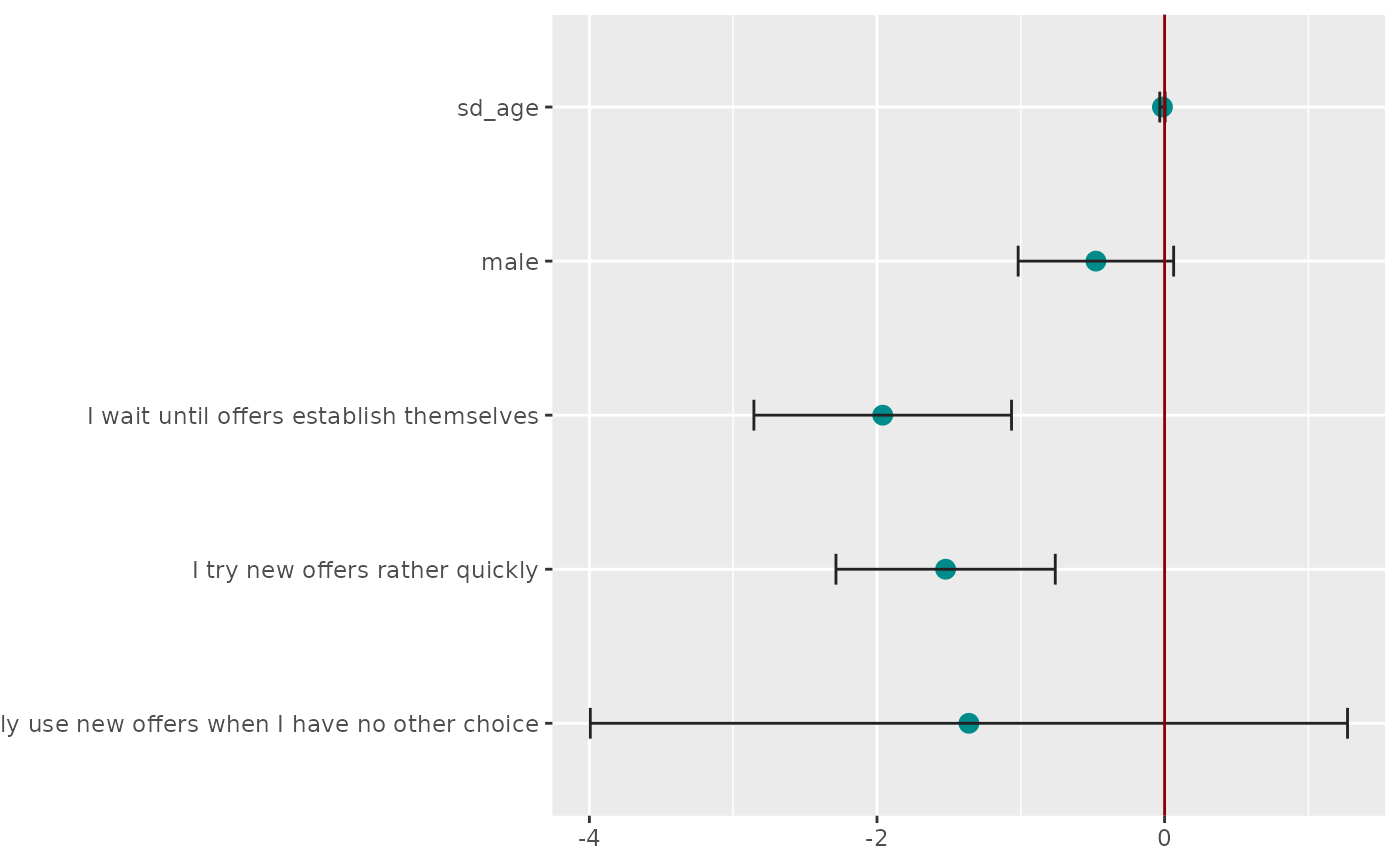
The regression output comes from stats::lm.
Usage
model_metrics_plot(
  data,
  col,
  categorical = NULL,
  metric = NULL,
  interactions = NULL,
  diagnostics = FALSE,
  labels = TRUE,
  clean = TRUE,
  ...
)
Arguments
- data
A tibble.
- col
The target column holding metric values.
- categorical
A tidy column selection holding categorical variables.
- metric
A tidy column selection holding metric variables.
- interactions
A vector of interaction effects to calculate. Each interaction effect should be provided as multiplication of the variables. Example:
c(sd_gender * adopter).- labels
If TRUE (default) extracts labels from the attributes, see codebook.
- clean
Prepare data by data_clean.
- ...
Placeholder to allow calling the method with unused parameters from effect_metrics.

