Kmeans clustering is performed using add_clusters.
![[Experimental]](figures/lifecycle-experimental.svg)
Usage
cluster_plot(
  data,
  cols,
  newcol = NULL,
  k = NULL,
  method = NULL,
  labels = TRUE,
  clean = TRUE,
  ...
)
Arguments
- data
A tibble.
- cols
A tidy selection of item columns or a single column with cluster values as a factor. If the column already contains a cluster result from add_clusters, it is used, and other parameters are ignored. If no cluster result exists, it is calculated with add_clusters.
- newcol
Name of the new cluster column as a character vector. Set to NULL (default) to automatically build a name from the common column prefix, prefixed with "cls_".
- k
Number of clusters to calculate. Set to NULL to output a scree plot for up to 10 clusters and automatically choose the number of clusters based on the elbow criterion. The within-sums of squares for the scree plot are calculated by
stats::kmeans.- method
The method as character value. Currently, only kmeans is supported. All items are scaled before performing the cluster analysis using
base::scale.- labels
If TRUE (default) extracts labels from the attributes, see codebook.
- clean
Prepare data by data_clean.
- ...
Placeholder to allow calling the method with unused parameters from plot_metrics.
Examples
library(volker)
data <- volker::chatgpt
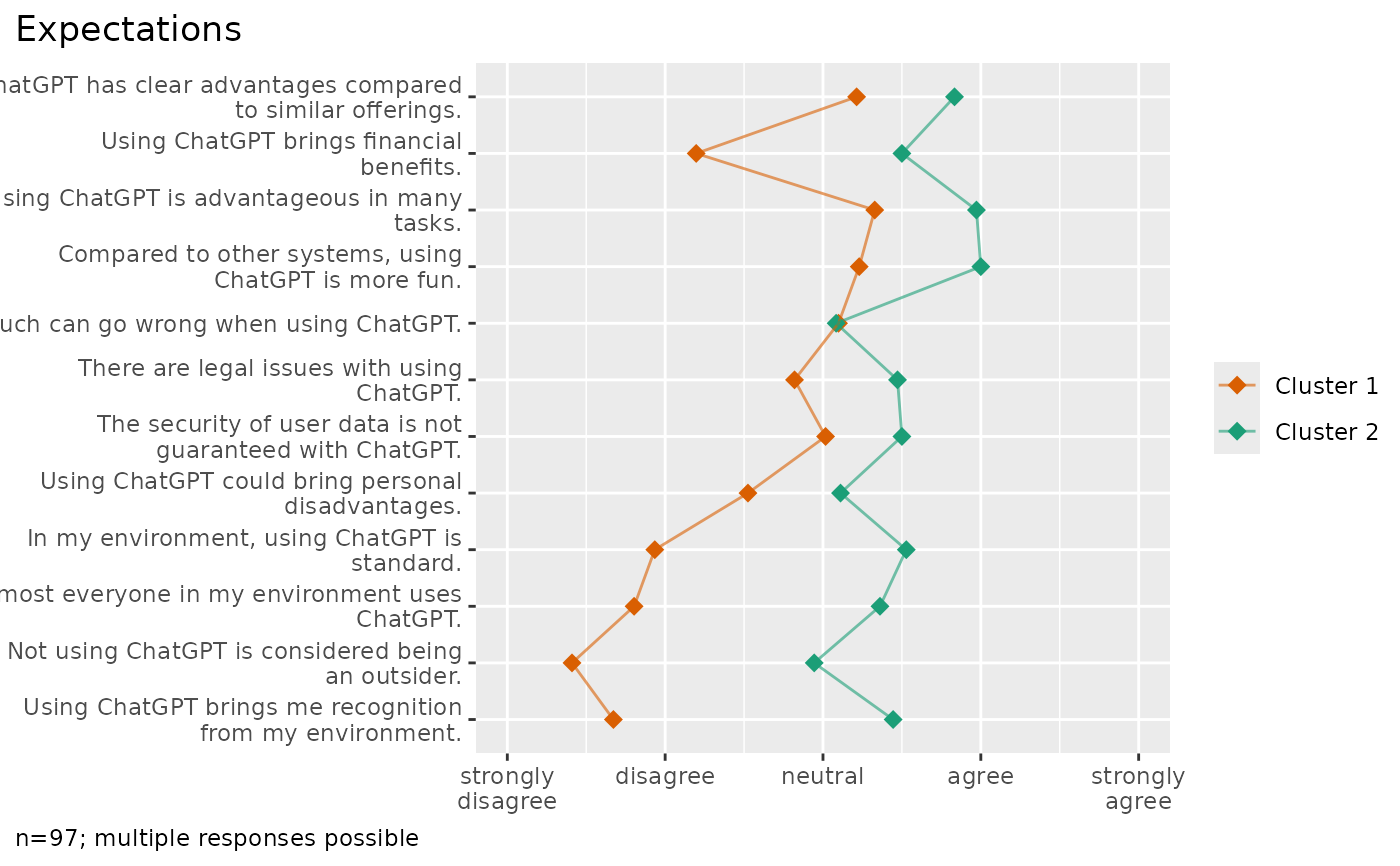
cluster_plot(data, starts_with("cg_adoption"), k = 2)
 #> In the plot, 4 missing case(s) omitted.